System health page and health endpoint checks
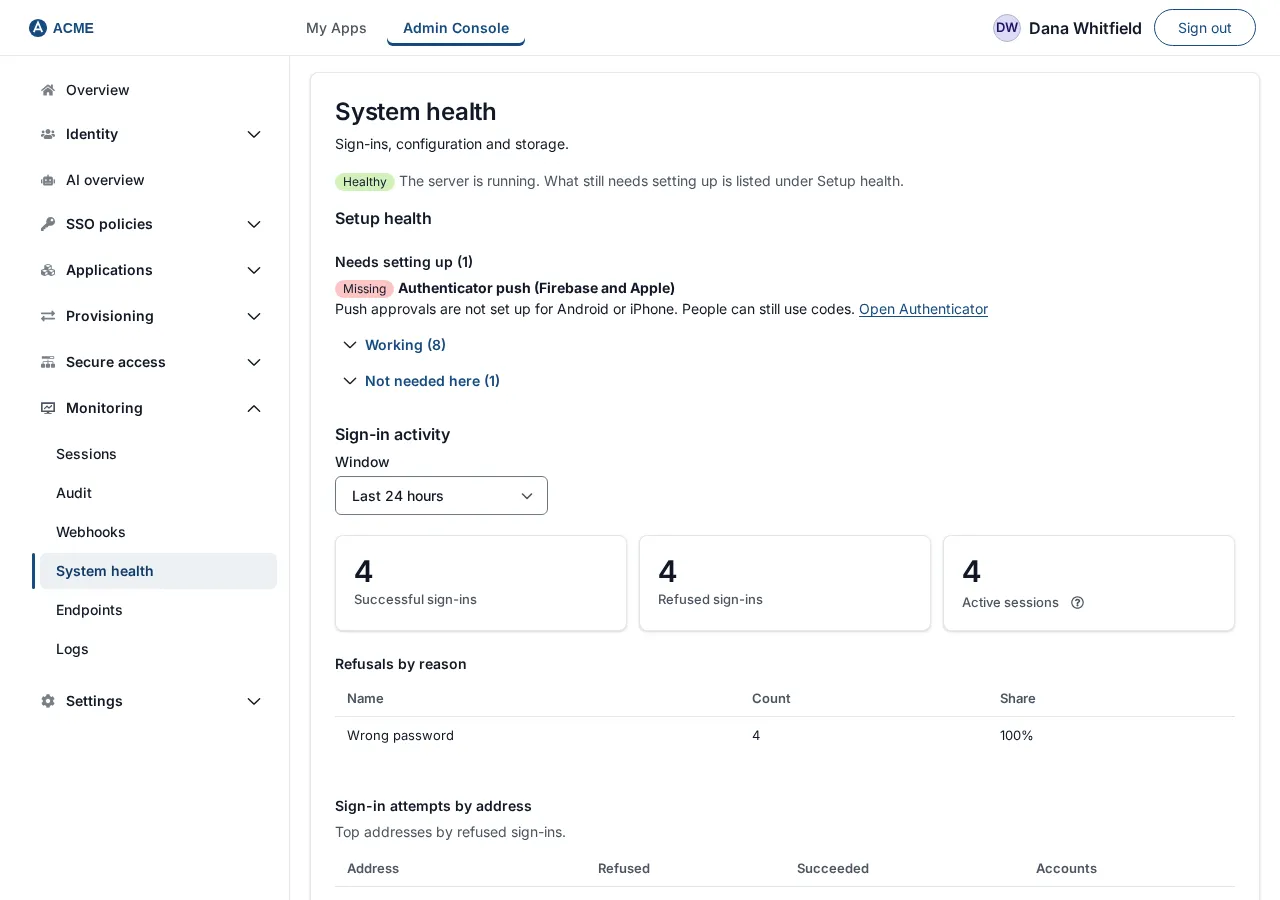
The System health page answers “is SSOGEN working, what does it still need, and what is it doing?” It combines a health badge, a Setup health checklist, sign-in activity for a chosen period, and the details of the deployment: its database, signing key, email notifications and client address, and how big the database is. No values that could be secret are ever shown. For monitoring tools, SSOGEN also has two health check endpoints that answer without signing in (see section 1).
Open it: sign in to the Admin Console, open Monitoring in the left-hand menu, then System health. It is read-only and changes nothing. Which blocks you see depends on your role; a role that may not read a block does not get it.
1. The health badge
Section titled “1. The health badge”Under the page title is one badge:
| Badge | Meaning |
|---|---|
| Healthy (green) | SSOGEN considers itself fully working. |
| Degraded (amber) | Something is not fully working. People can usually still sign in. |
| Needs attention (amber) | SSOGEN cannot reach its database. |
| Unknown | The page could not tell. |
Beside the badge the page says: “The server is running. What still needs setting up is listed under Setup health.”
When the badge is not Healthy, a list headed “Why this server is degraded” explains each reason in plain words. Today the reason this page can name is: AI agents cannot get tokens: no AI agent signing key is installed. Sign-in for people is unaffected. The person who runs SSOGEN installs that key as the install guide describes, in its section on the signing keystore; Setup health shows when it is in place. For any other cause the page says: A part of this SSOGEN server is not working fully; people can still sign in.
If you see Loading organization status… for more than a few seconds, reload the page.
Health check endpoint for load balancers
Section titled “Health check endpoint for load balancers”Two addresses on SSOGEN answer without signing in. They are for machines, not people.
| Address | Answer |
|---|---|
/health/live |
200 when SSOGEN process is running. |
/health/ready |
200 when SSOGEN is ready to take traffic, 503 when it is not (for example, it cannot reach its database). |
2. Setup health
Section titled “2. Setup health”Setup health lists what this server still needs and what already works, each with the reason and a link to the screen that fixes it (“Open SMTP”, for example). Items that are missing (Missing, under Needs setting up) or need attention (Attention, under Needs attention) are listed open; the ones that work (OK, under Working) and the ones that do not apply to you (Not needed, under Not needed here) are one click away. When nothing is wrong the page says “Nothing needs setting up. Everything this server needs is in place.”
| Item | What it checks |
|---|---|
| Mail server (SMTP) | A mail server is set up and no email failed in the last 24 hours. Without one, sign-in links, email codes and notifications are not sent. |
| Authenticator push | Push approvals can reach Android and iPhone. |
| Sign-in requests reported | Needs attention when anyone answered a sign-in request “This wasn’t me” in the last 24 hours: someone else may know their password, their push approvals are paused for a while, and the item sends you to the audit log to find them, check with them and reset their password. |
| HTTPS certificate of this server | When the certificate on SSOGEN’s own listener expires. A self-signed certificate is normal there (the public certificate belongs on your load balancer or web server). Not needed when TLS ends at your proxy. |
| Signing key | The key SSOGEN signs tokens and assertions with is present and valid. |
| AI agent key | The key that signs AI agent tokens is installed and valid. |
| Certificate authority for agents and Gateways | The authority the installer creates so Web Agents and Gateways need no hand-made CA is present. |
| Gateways and Gateway group … | Whether a Gateway group exists and has a Gateway reporting in. You need one only to publish applications through the App Proxy. |
| Client address and trusted proxies | Whether SSOGEN sees the person’s real address behind your load balancer (see Network zones). |
| Sign-in links and phone sign-in | Names any policy that turns on an emailed sign-in link or phone sign-in but is neither the default nor used by an application (so nobody is offered it), or that is the Admin Console’s policy, which never offers them. |
3. Rules being monitored
Section titled “3. Rules being monitored”Only if a rule list is currently being trialled in monitoring mode, a section Rules being monitored lists each one, for example “Access rules version 2” with a Monitoring badge and when the trial ends. If nothing is being monitored, the section is not shown. See Defaults and monitoring for how to start one.
4. Sign-in activity
Section titled “4. Sign-in activity”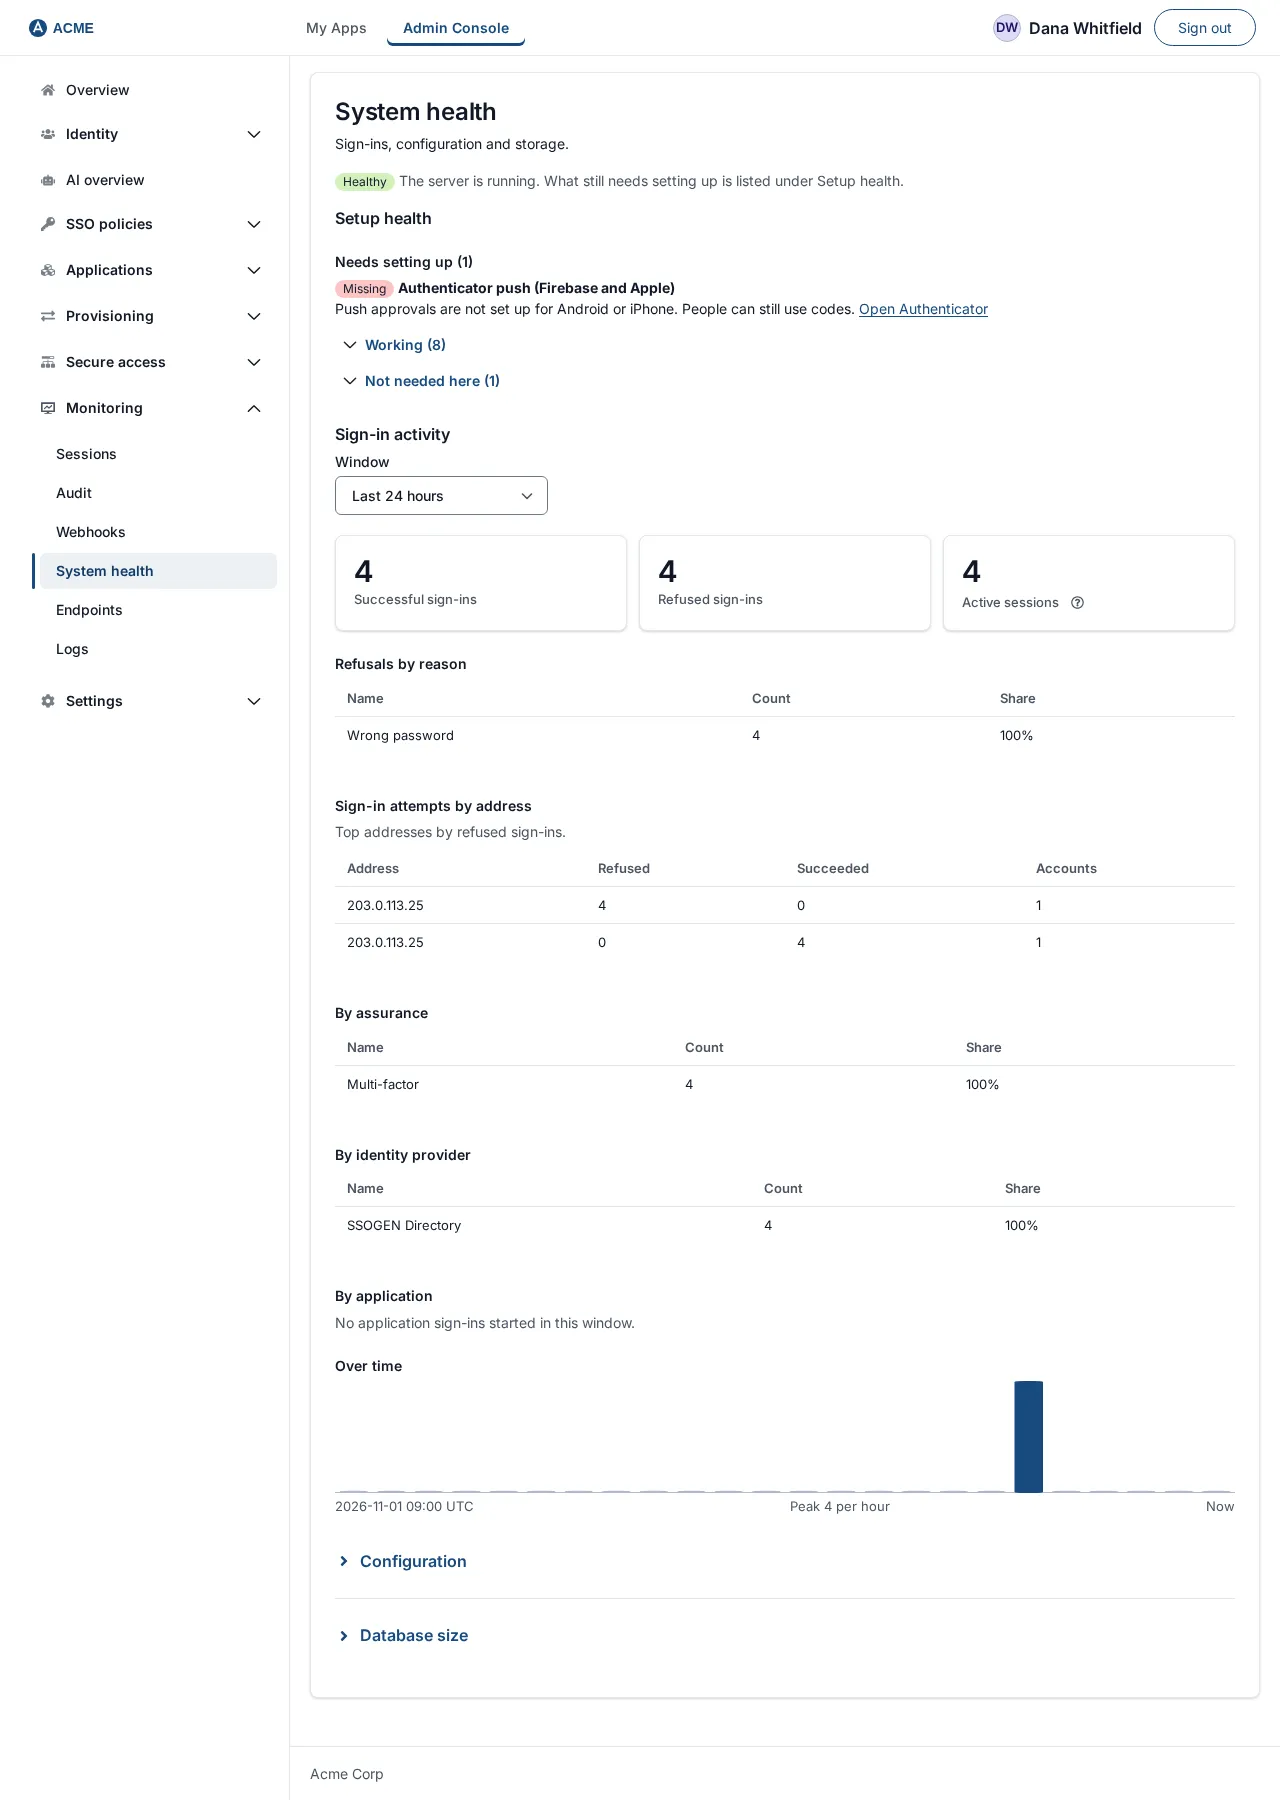
- Under Sign-in activity, choose a period in the Window menu: Last hour, Last 24 hours (the default), Last 7 days or Last 30 days.
- Read the three counters: Successful sign-ins, Refused sign-ins and Active sessions (people signed in right now: “Signed in and not expired or signed out, across everyone.”).
- Below them, up to six breakdowns appear:
| Block | What it tells you |
|---|---|
| Refusals by reason | Only shown when there were refusals. Why sign-ins were refused: the count and share of each reason. |
| Sign-in attempts by address | The ten addresses with the most refusals, with Refused, Succeeded and Accounts counts. One address with many refusals and no successes is the pattern worth investigating. An address where many accounts also succeed is usually an office. |
| By assurance | How strongly people proved who they are (for example, password only or with a second step). |
| By identity provider | Which sign-in source people used. |
| By application | Sign-ins started for each application. It counts what browsers were on their way to, not completed authentications. A role that may not read applications sees “An application” in place of names. |
| Over time | A small bar chart of sign-ins per hour. |
While loading you will see Loading activity…. A block with nothing says so: No refusals in this window., No sign-in attempts in this window. or No sign-ins in this window.
5. Configuration
Section titled “5. Configuration”The sections below can be collapsed with the arrow beside their heading. Configuration has five parts: Database, Signing key, Email notifications, Client address and Inventory.
| Item | Meaning |
|---|---|
| Database: Reachable | yes or no. |
| Schema version | The version of the database layout. It rises with every upgrade. |
| Migrations applied | How many database updates have been applied. After an upgrade this number should have gone up. |
| Failed migrations | Must be 0. Anything else means an upgrade did not complete; see Backups and upgrades. |
| Signing key: Available | yes when SSOGEN has the key it signs tokens and sign-in assertions with. |
| Key ID, Certificate, Valid until | Which key, its certificate subject and the date it expires. Put the Valid until date in your calendar: an expired signing key breaks every application that trusts SSOGEN. |
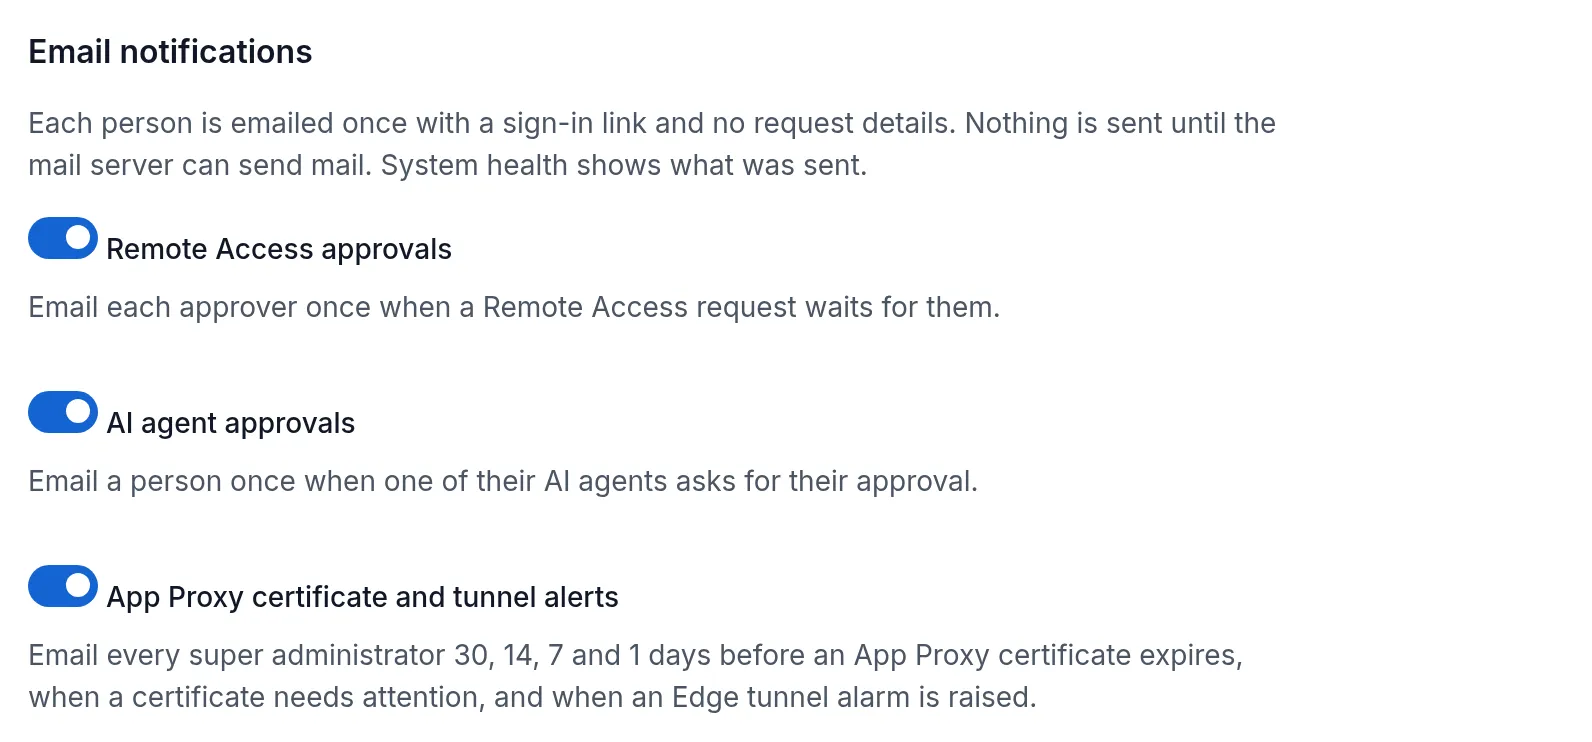
| Email notifications | Whether a mail server is set up; for each notification (Remote Access approvals, AI agent approvals, App Proxy certificate expiry, App Proxy certificate attention and Edge tunnel alarms) whether it is on or off (the last three share one switch on the SMTP page, App Proxy certificate and tunnel alerts); and Last 24 hours: how many were sent, failed, not sent or waiting, with the last problem and why (for example “there is no mail server”). |
| Client address | Trusted proxies (or “none (the connecting address is the person’s)”), which header is Read from, and how many requests arrived with a forwarding header from an address that is not trusted. A warning appears when a request carried such a header from an address you have not listed: everyone behind it then appears under its address, sign-in limits are shared and network zones match its network. Add the proxy to SSOGEN_TRUSTED_PROXY_CIDRS and restart. A second warning appears when every connection came from a private address with no forwarding header and no proxy is trusted. |
| Inventory | Counts: Identity providers, Sign-in policies, Applications, SAML service providers, Users, Groups, Audit events. A count the page could not read says unavailable. |
The switch for the last three notifications is on Settings, SMTP, labelled App Proxy certificate and tunnel alerts: “Email every super administrator 30, 14, 7 and 1 days before an App Proxy certificate expires, when a certificate needs attention, and when an Edge tunnel alarm is raised.” Tunnel alarms are explained in Outbound Connector for private networks and Reach a Gateway through a relay.
6. Endpoints (its own page)
Section titled “6. Endpoints (its own page)”Monitoring, Endpoints is a page of its own. It lists, in four groups, the addresses other systems are configured with. They are built from the organization’s one public address (for example https://sso.acme.example), not from the address you happen to have the console open on, so they are always safe to copy into another system.
| Group | Entries |
|---|---|
| Sign-in | Login, Logout, My Apps, Administration |
| OpenID Connect / OAuth 2.0 (SSOGEN as the provider) | Discovery, Authorize, Token, UserInfo, JWKS, Introspection, Revocation, End session, Pushed authorization |
| SAML (SSOGEN as the identity provider) | IdP metadata, IdP SSO, IdP SLO |
| SAML (SSOGEN as a service provider) | SP metadata, SP entity ID, ACS, Start sign-in, each with {connectionId} standing for the identity provider connection’s id |
7. Database size
Section titled “7. Database size”Database size (How much room this deployment is taking, and what is taking it.) shows three counters: Total size, Tables and Audit rows, then a table Largest tables with each table’s Size and approximate Rows. The audit log is expected at the top: it is shortened only by archiving or retention, which is deliberate.
8. Logs
Section titled “8. Logs”Monitoring, Logs shows the newest lines of this server’s own logs, for an administrator who has no shell on the server. Only a Super admin can open it. It has two tabs: Errors and warnings (SSOGEN log) and Access log. Choose Lines (100, 200, 500 or 1000); on SSOGEN log choose Lowest level (Errors, Warnings and errors, Everything); type text in Contains to filter (applied when you refresh, up to 200 characters on one line); tick Refresh every 10 seconds to follow it. The access log starts each line with the person’s real address, as the client address setting finds it. Behind a load balancer each server has its own log, and the page shows the one that answered. Sensitive values are redacted. Each view is recorded in the audit log (at most every five minutes while the page refreshes). If the log cannot be shown, the page says why, for example “Too many log views in the last minute. Wait a minute, then refresh.”
If something does not load
Section titled “If something does not load”| Message | What to do |
|---|---|
| Could not load the configuration summary. | Reload. If it persists, check SSOGEN’s own logs. |
| Could not load the database statistics. | Same. |
| Could not reach the server. | SSOGEN did not answer. Check it is running (/health/live). |
Related pages: The audit log, Backups and upgrades.